


The Challenge: A Critical Bottleneck in a Business-Essential Application
The core of the problem lay in a specific API endpoint that was buckling under the pressure of even a small number of concurrent users. It was a classic performance bottleneck. Managers, who rely on the Weekly Screen to approve timesheets and manage payroll, were the most affected. The slow load times not only delayed a core business process but also created a negative user experience that eroded confidence in the software.
- User Frustration: The 20-second wait time was a significant source of frustration for daily users.
- Productivity Drain: The delays were directly impacting the efficiency of a critical administrative task.
- System Instability: Initial diagnostics showed the system was not just slow, but failing.
The Solution: A Data-Driven Approach to Performance Engineering
Our dedicated team of performance testing experts at Enkaytech immediately initiated a comprehensive analysis. We ran targeted load tests that quickly confirmed our suspicions. The data was eye-opening. With just five virtual users, the system’s success rate dropped to 0%, meaning it was completely unable to function under minimal stress.
The key performance metrics before our intervention told a story of a system on the verge of collapse:
- High Latency: Average response times were shockingly slow, ranging from 7 seconds to over 19 seconds.
- Low Reliability: As user load increased, the system crumbled. A mere three virtual users caused the success rate to plummet to 11.11%.
- Scalability Issues: The application was fundamentally unable to scale to meet basic business demands.
Armed with this clear, undeniable data, our performance testers worked in close collaboration with our development team. This detailed, empirical evidence was the roadmap our developers needed to target their efforts precisely.
The Technical Fixes: Rebuilding for Speed and Efficiency
Our development team wasted no time implementing a series of strategic technical optimizations. These weren’t just quick fixes; they were a fundamental re-engineering of the application’s core logic.
- Eliminated N+1 Queries: By refactoring the code to reduce unnecessary database calls, we significantly cut down on the time spent retrieving data.
- Implemented Data Caching: We utilized precomputed dictionaries, which allowed for constant-time (O(1)) data lookups. This dramatically improved response speed.
- Streamlined Logic: We eliminated redundant work within the API’s internal logic, making the entire process more efficient.
- Code Refactoring: The code was made more maintainable and scalable, paving the way for future improvements and growth.
The Outcome: A Dramatic Transformation
Following the development fixes, our QA service team conducted a second round of validation. The results were nothing short of a stunning success. The application’s performance improved beyond all expectations, with response times now measured in milliseconds.
How Enkaytech Transformed a Lagging App into a Lightning-Fast Platform
For any business, a smooth workflow is the key to productivity. But for one of our clients, a crucial part of their daily operations—the business application—was causing major headaches. The challenge? Managers were waiting up to 20 seconds just to pull up employee timesheets. This wasn’t just a minor delay; it was a major roadblock, causing frustration and slowing down the entire team. The problem was a specific API that simply couldn’t handle the user load.
The Fix: Finding the Bottleneck with Precision Performance Testing
Our dedicated QA team took on the challenge. We knew we had to act fast, so we ran a targeted smoke test that quickly pinpointed the problem API. The initial results were shocking. Under a load of just five virtual users, the application’s success rate dropped to a dismal 0%.
The numbers spoke for themselves:
- High Latency: Average response times were slow, ranging from 7 to over 19 seconds.
- Low Reliability: With just three virtual users, the success rate plummeted to 11.11%. At five users, it completely failed, with a 0% success rate.
Armed with this clear data, our performance testers worked hand-in-hand with our development team. The detailed metrics provided a clear roadmap, allowing the developers to focus their efforts on the exact areas that needed improvement.
The Solution: A Technical Overhaul for a Seamless User Experience
Our developers went to work, implementing a series of key technical fixes to overhaul the API’s performance:
- Eliminated N+1 queries: This drastically reduced the number of database calls, speeding up data retrieval.
- Used precomputed dictionaries: By doing this, we achieved near-instantaneous data lookups, cutting down on wait times.
- Streamlined internal logic: We refactored the code to remove redundant work and improve efficiency.
The result was a total transformation.
The Outcome: From Seconds to Milliseconds
After the fixes were implemented, our team ran a second round of performance tests. The difference was night and day. Response times, once measured in agonizing seconds, were now in lightning-fast milliseconds.
The numbers speak for themselves:
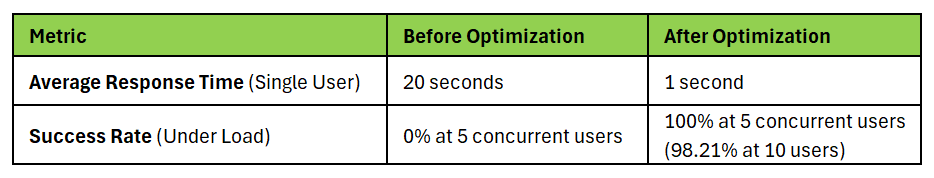
- Massive Latency Reduction: The average response time for a single user dropped by over 85%, from 20 seconds to just 1 seconds. Under load, the improvement was even more dramatic.
- Near-Perfect Reliability: The success rate was restored to 100% under all tested user loads, demonstrating the system’s newfound stability and scalability.
This successful, in-house collaboration was a powerful example of how performance optimization and agile development can transform a struggling application. The precise diagnostic work of our Quality Assurance team and the efficient fixes by our development team ensured our client now enjoys a seamless and fast experience with their critical timesheet data. This case highlights the invaluable role of rigorous performance testing and the power of internal teamwork in ensuring application reliability, digital transformation, and a positive experience for customers.
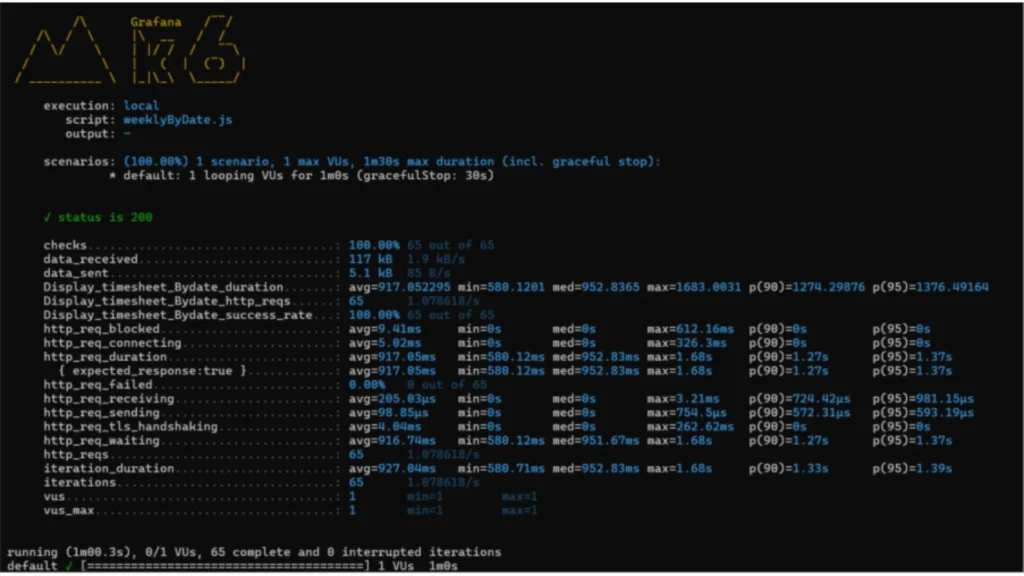
Quick Over

Notes on abbreviations:
- VUs = Virtual Users (load applied in the test)
- Max (ms) = Maximum response time in milliseconds
- Avg Duration (ms) = Average response time in milliseconds
- p(95) (ms) = 95th percentile response time (latency threshold)
- No. of HTTP Reqs = Total requests completed
- Req/s = requests per second (throughput)
Testimonial
“We were at our wit’s end with the delays in the business app. Our managers were getting frustrated, and it was a serious drag on our productivity. The Enkaytech team didn’t just tell us we had a problem—they showed us with clear, undeniable data. Then, they fixed it with an incredible level of precision and speed. The transformation was unbelievable. What used to be a 20-second wait is now almost instantaneous. This isn’t just about a faster app; it’s about a better, more efficient business. We couldn’t be happier with the results.” — Senior Manager, Operations